3. EE 0 - Single Site Run
Example Experiment 0: We want to conduct a full single-site simulation, explore the output data and produce preliminary plots.
The example solutions assume that you are running on the dvmdostem Docker
stack. Example solutions are presented in collapsable blocks. The blocks are
color coded:
Full working solution.
This example should work!
Partial solution.
This example should get you most of the way there.
Broken solution.
This example might have problems. Use at your own risk and expect to debug.
3.1. Experiment Design
Here we have designed a small experiment with answers to the unknowns posed in setting up a run
Question |
Answer |
Where on your computer you want to store
your model run(s)?
|
|
What spatial (geographic) area you want
to run?
|
Toolik, pixels (0,0), (1,1), (2,2)
/work/demo-data/cru-ts40_ar5_rcp85_ncar-ccsm4_toolik_field_station_10x10/ |
What variables you want to output? |
GPP: monthly, by PFT
RHSOM, RG, RM: monthly
TLAYER: monthly by layer
VEGC: yearly
ALD: yearly
CMTNUM: yearly
LAYERDZ, LAYERDEPTH, LAYERTYPE: yearly
SHLWC, SHLWDZ: yearly
DEEPC, DEEPDZ: yearly
MINEC: yearly
|
Which stages to run and for how many years? |
All stages, pr 100, eq 1000, sp 250, tr 115, sc 85 |
Is the community type (CMT) fixed or driven by
input vegetation.nc map?
|
Force to CMT05 |
For which stages should the output files be
generated and saved?
|
sp, tr, sc |
Calibration settings if necessary
(i.e.
--cal-mode)? |
No |
Any other command line options or environment
settings?
|
No |
Warning
The util/outspec.py script prints some confusing messages when working
with by-layer files. For outputs that are only available by layer, (i.e.
LAYERDZ), the output is flagged as ‘invalid’ in the output_spec.csv file.
This means that if you provide the layer resolution specification when
requesting one of these outputs, util/outspec.py will print a message to
the extent of “Not enabling layer outputs for LAYERDZ”. This is true
(util/outspec.py finds the “invalid” marker and doesn’t enable that
column in the .csv file), but it is not a problem - for those outputs, the
by-layer resolution is enforced internally in the C++ part of the model.
Developer commands for working on documentation
Uncomment the following jupyter execute block if you need to actually run the model for this experiment. With this block uncommented, when you build the sphinx documentation, it will run this block of code which should actually run the model and create the files needed for the rest of this demonstration. This is useful if you are a developer working on the documentation and you need to test run some of the commands or make more examples. The intention is that generated data for the example need not be stored in the repository.
# import os
# import subprocess
# import shutil
#
# from pyddt.util import setup_working_directory
# from pyddt.util import outspec
# from pyddt.util import runmask
#
# shutil.rmtree('/data/workflows/docs/example_experiment_0/', ignore_errors=True)
#
# args = '--input-data-path /work/demo-data/cru-ts40_ar5_rcp85_ncar-ccsm4_toolik_field_station_10x10/ /data/workflows/docs/example_experiment_0/'
# setup_working_directory.cmdline_entry(args.split(' '))
#
# os.chdir('/data/workflows/docs/example_experiment_0/')
#
# outspec.cmdline_entry('config/output_spec.csv --on RHSOM m'.split(' '))
# outspec.cmdline_entry('config/output_spec.csv --on RG m'.split(' '))
# outspec.cmdline_entry('config/output_spec.csv --on RM m'.split(' '))
# outspec.cmdline_entry('config/output_spec.csv --on TLAYER l m'.split(' '))
# outspec.cmdline_entry('config/output_spec.csv --on GPP m p'.split(' '))
# outspec.cmdline_entry('config/output_spec.csv --on VEGC y'.split(' '))
# outspec.cmdline_entry('config/output_spec.csv --on ALD y'.split(' '))
# outspec.cmdline_entry('config/output_spec.csv --on CMTNUM y'.split(' '))
# outspec.cmdline_entry('config/output_spec.csv --on SHLWC y l'.split(' '))
# outspec.cmdline_entry('config/output_spec.csv --on SHLWDZ y l'.split(' '))
# outspec.cmdline_entry('config/output_spec.csv --on DEEPC y l'.split(' '))
# outspec.cmdline_entry('config/output_spec.csv --on DEEPDZ y l'.split(' '))
# outspec.cmdline_entry('config/output_spec.csv --on MINEC y l'.split(' '))
# outspec.cmdline_entry('config/output_spec.csv --on LAYERDZ y'.split(' '))
# outspec.cmdline_entry('config/output_spec.csv --on LAYERDEPTH y'.split(' '))
# outspec.cmdline_entry('config/output_spec.csv --on LAYERTYPE y'.split(' '))
#
# runmask.cmdline_entry('--reset run-mask.nc'.split(' '))
# runmask.cmdline_entry('--yx 0 0 run-mask.nc'.split(' '))
#
# subprocess.call('dvmdostem -l fatal --force-cmt 5 -p 100 -s 250 -e 1000 -t 115 -n 85'.split(' '))
Example commands for setting up
$ ./scripts/setup_working_directory.py --input-data-path /work/demo-data/cru-ts40_ar5_rcp85_ncar-ccsm4_toolik_field_station_10x10/ /data/workflows/docs/example_experiment_0/
$ cd /data/workflows/docs/example_experiment_0/
$ outspec.py config/output_spec.csv --on RHSOM m
$ outspec.py config/output_spec.csv --on RG m
$ outspec.py config/output_spec.csv --on RM m
$ outspec.py config/output_spec.csv --on TLAYER l m
$ outspec.py config/output_spec.csv --on GPP m p
$ outspec.py config/output_spec.csv --on VEGC y
$ outspec.py config/output_spec.csv --on ALD y
$ outspec.py config/output_spec.csv --on CMTNUM y
$ outspec.py config/output_spec.csv --on SHLWC y l
$ outspec.py config/output_spec.csv --on SHLWDZ y l
$ outspec.py config/output_spec.csv --on DEEPC y l
$ outspec.py config/output_spec.csv --on DEEPDZ y l
$ outspec.py config/output_spec.csv --on MINEC y l
$ outspec.py config/output_spec.csv --on LAYERDZ y
$ outspec.py config/output_spec.csv --on LAYERDEPTH y
$ outspec.py config/output_spec.csv --on LAYERTYPE y
$ runmask.py --reset run-mask.nc
$ runmask.py --yx 0 0 run-mask.nc
$ #runmask.py --yx 1 1 run-mask.nc
$ #runmask.py --yx 2 2 run-mask.nc
$ dvmdostem --force-cmt 5 -p 100 -s 250 -e 1000 -t 115 -n 85
3.2. Example Python setup
The Python example solutions share a bunch of code. For this reason, we will put the common setup here and not need to repeat these lines in each example. The paths assume that these examples will be run on the TEM Docker stack. Subsequent Python example solutions assume that these setup commands have been run. In other words if you are following along, copy the following code into your Python interpreter and run it before continuing.
To read more about the data loading function that is imported from
util/output.py please see the API documentation here
util.output.load_trsc_dataframe()
If you are not working on the TEM Docker stack or have named your experiment differently, please adjust your paths accordingly.
Common Python setup
import sys
import os

import netCDF4 as nc
import pandas as pd
import matplotlib.pyplot as plt

from pyddt.util.output import load_trsc_dataframe

# This lets us work with shorter paths relative to the experiment
# directory
os.chdir('/data/workflows/docs/example_experiment_0/')
3.3. Explore Input Datasets
Exploring the input dataset, determine the start year of the historical, and the projected climate time series. From the length of the time dimension, compute the end year and the total number of years of the time series. Note that this information is used to set the number of transient and scenario years to run.
Example with ncdump
$ ncdump -h /work/demo-data/cru-ts40_ar5_rcp85_ncar-ccsm4_toolik_field_station_10x10/historic-climate.nc  | grep "time:units"
    time:units = "days since 1901-1-1 0:0:0" ;

$ ncdump -h /work/demo-data/cru-ts40_ar5_rcp85_ncar-ccsm4_toolik_field_station_10x10/projected-climate.nc  | grep "time:units"
    time:units = "days since 2016-1-1 0:0:0" ;

$ ncdump -h /work/demo-data/cru-ts40_ar5_rcp85_ncar-ccsm4_toolik_field_station_10x10/historic-climate.nc  | grep "time\ =\ "
    time = UNLIMITED ; // (1380 currently)

$ ncdump -h /work/demo-data/cru-ts40_ar5_rcp85_ncar-ccsm4_toolik_field_station_10x10/projected-climate.nc  | grep "time\ =\ "
    time = UNLIMITED ; // (1020 currently)
So 1380/12 = 115. Looks like 115 years for the historic and 1020/85 =
85 for the projected.
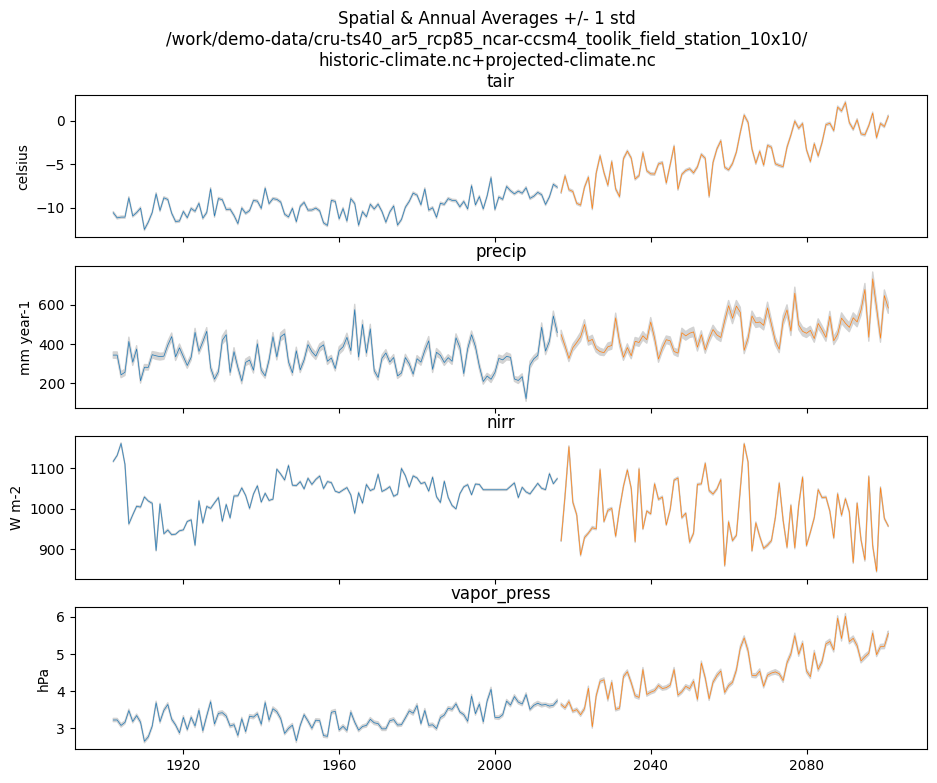
Example input.py plot
This shows how you might plot the driving inputs using one of the existing utility scripts. While the graphical view is nice it makes it difficult to figure out the exact start and end years.
Also notice that this technique allows us to interact with the command line
interface of the input.py script directly from a Python interpreter.
Neat!
import argparse

import pyddt.util.input

args = {
  'command': 'climate-ts-plot',
  'input_folder': '/work/demo-data/cru-ts40_ar5_rcp85_ncar-ccsm4_toolik_field_station_10x10/',
  'stitch': False,
  'type': 'spatial-temporal-summary',
}

pyddt.util.input.climate_ts_plot(argparse.Namespace(**args))
3.4. Computing Mean Vegetation C and Soil C
Compute the mean vegetation and soil carbon stocks for the following time ranges: [1990-1999], [2040-2049], [2090-2099].
What are the units of these stocks?
Example Python Solution
for VAR in ['VEGC', 'SHLWC', 'DEEPC', 'MINEC']:
  TIMERES = 'yearly'
  PX_X = 0
  PX_Y = 0
  time_ranges = ['1990-1999','2040-2049','2090-2099']

  df, meta = load_trsc_dataframe(var=VAR, timeres=TIMERES, px_y=PX_Y,
                                 px_x=PX_X, fileprefix='output')
  print(meta)
  for d in time_ranges:
     s, e = d.split('-')
     mean = df[s:e].mean()[0]
     print(f'{d}  {VAR}  mean: {mean}')
  print()
Trying to open:  output/VEGC_yearly_tr.nc
Trying to open:  output/VEGC_yearly_sc.nc
{'var_units': 'g/m2'}
1990-1999  VEGC  mean: 1355.8393554508687
2040-2049  VEGC  mean: 1480.6718041539193
2090-2099  VEGC  mean: 1617.4302710831166

Trying to open:  output/SHLWC_yearly_tr.nc
Trying to open:  output/SHLWC_yearly_sc.nc
{'var_units': 'g/m2'}
1990-1999  SHLWC  mean: 2188.245476913452
2040-2049  SHLWC  mean: 2265.0517971038817
2090-2099  SHLWC  mean: 2494.3678314208983

Trying to open:  output/DEEPC_yearly_tr.nc
Trying to open:  output/DEEPC_yearly_sc.nc
{'var_units': 'g/m2'}
1990-1999  DEEPC  mean: 4199.49971268028
2040-2049  DEEPC  mean: 4237.533560976386
2090-2099  DEEPC  mean: 4317.014717506618

Trying to open:  output/MINEC_yearly_tr.nc
Trying to open:  output/MINEC_yearly_sc.nc
{'var_units': 'g/m2'}
1990-1999  MINEC  mean: 20947.73403910827
2040-2049  MINEC  mean: 20919.83614923507
2090-2099  MINEC  mean: 20903.745516211355
Example NCO solution
### Change into the experiment directory
cd /data/workflows/docs/example_experiment_0/

### Create a synthesis directory to store all the summary stats
mkdir /data/workflows/docs/example_experiment_0/synthesis

### Compute the decadal means of vegetation carbon stocks
ncwa -O -d time,89,98 -d x,0 -d y,0 -y avg -v VEGC output/VEGC_yearly_tr.nc  synthesis/VEGC_1990_1999.nc
ncwa -O -d time,24,33 -d x,0 -d y,0 -y avg -v VEGC output/VEGC_yearly_sc.nc  synthesis/VEGC_2040_2049.nc
ncwa -O -d time,74,83 -d x,0 -d y,0 -y avg -v VEGC output/VEGC_yearly_sc.nc  synthesis/VEGC_2090_2099.nc

### Store all soil C stocks to a single file
cp output/SHLWC_yearly_tr.nc synthesis/SOILC_yearly_tr.nc
ncks -A -h output/DEEPC_yearly_tr.nc synthesis/SOILC_yearly_tr.nc
ncks -A -h output/MINEC_yearly_tr.nc synthesis/SOILC_yearly_tr.nc

cp output/SHLWC_yearly_sc.nc synthesis/SOILC_yearly_sc.nc
ncks -A -h ./output/DEEPC_yearly_sc.nc synthesis/SOILC_yearly_sc.nc
ncks -A -h ./output/MINEC_yearly_sc.nc synthesis/SOILC_yearly_sc.nc

### Compute total soil carbon
ncap2 -O -h -s'SOILC = SHLWC + DEEPC + MINEC' synthesis/SOILC_yearly_tr.nc synthesis/SOILC_yearly_tr.nc
ncap2 -O -h -s'SOILC = SHLWC + DEEPC + MINEC' synthesis/SOILC_yearly_sc.nc synthesis/SOILC_yearly_sc.nc

### Compute the decadal means of soil carbon stocks
ncwa -O -d time,89,98 -d x,0 -d y,0 -y avg -v SHLWC,DEEPC,MINEC,SOILC synthesis/SOILC_yearly_tr.nc  synthesis/SOILC_1990_1999.nc
ncwa -O -d time,24,33 -d x,0 -d y,0 -y avg -v SHLWC,DEEPC,MINEC,SOILC synthesis/SOILC_yearly_sc.nc  synthesis/SOILC_2040_2049.nc
ncwa -O -d time,74,83 -d x,0 -d y,0 -y avg -v SHLWC,DEEPC,MINEC,SOILC synthesis/SOILC_yearly_sc.nc  synthesis/SOILC_2090_2099.nc
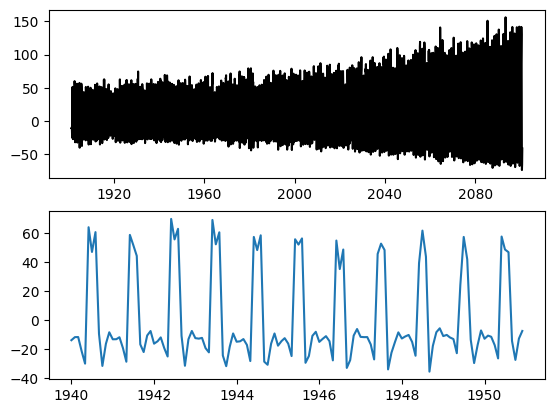
3.5. Computing Monthly NEE
Compute monthly Net Ecosystem Exchange (NEE) for the historical and scenario simulations. Indicate how you formulated NEE.
Python solution 1
Autotrophic respiration (RA) is the sum of growth respiration (RG) and maintenance respiration (RM). RG and RM encompass all vegetation respiration (both above and below ground).
Heterotrophic respiration (RHSOM) is the microbial respiration in the soil.
Ecosystem respiration (ER) is the sum of RA and RHSOM.
Net Ecosystem Exchange (NEE) is Gross Primary Productivity (GPP) less ER.
dvmdostem does not have explicit outputs for RA, ER, or NEE, so we will
derive them from our existing outputs (GPP, RHSOM, RM, RG).
X = 0
Y = 0

rh, _ = load_trsc_dataframe('RHSOM', timeres='monthly', px_y=Y, px_x=X, fileprefix='output')
rm, _ = load_trsc_dataframe('RM', timeres='monthly', px_y=Y, px_x=X, fileprefix='output')
rg, _ = load_trsc_dataframe('RG', timeres='monthly', px_y=Y, px_x=X, fileprefix='output')
gpp, _ = load_trsc_dataframe('GPP', timeres='monthly', px_y=Y, px_x=X, fileprefix='output')

# GPP is output per PFT, so here we sum across PFTs to get
# the ecosystem GPP.
gpp_eco = gpp.sum(axis=1)

# Add up all the respiration fluxes
er = (rh + rm + rg)

nee = gpp_eco - er.squeeze() # <-- collapse single column pandas.DataFrame
Trying to open:  output/RHSOM_monthly_tr.nc
Trying to open:  output/RHSOM_monthly_sc.nc
Trying to open:  output/RM_monthly_tr.nc
Trying to open:  output/RM_monthly_sc.nc
Trying to open:  output/RG_monthly_tr.nc
Trying to open:  output/RG_monthly_sc.nc
Trying to open:  output/GPP_monthly_tr.nc
Trying to open:  output/GPP_monthly_sc.nc
matplotlib
fig, axes = plt.subplots(2,1)

axes[0].plot(nee, color='black', label='NEE')
axes[1].plot(nee['1940':'1950'])

plt.savefig('NEE_SAMPLE.png')
bokeh
Note
This does not display properly in all web browsers. Safari in particular seems to have issues. It should work fine if you run the code on your own machine, but for some reason when embedded in the Sphinx documentation, it doesn’t behave.
import bokeh.plotting as bkp
import bokeh.resources as bkr
import bokeh.io as bkio

# This helps display inline in sphinx document,
# in other contexts you may not need this line.
bkio.output_notebook(bkr.CDN, verbose=False,
                     notebook_type='jupyter', hide_banner=True)

p = bkp.figure(title="NEE", x_axis_type='datetime',
               sizing_mode="stretch_width", max_width=500, height=150,
               toolbar_location='above')

p.line(nee.index, nee, line_width=1)

bkp.show(p)
NCO solution
Warning
This code runs, but the values don’t match the Python solution and the
dates seem off in the final *.nc files. Needs further verification.
### Change into the experiment directory
cd /data/workflows/docs/example_experiment_0/

### Create a synthesis directory to store all the summary stats
mkdir /data/workflows/docs/example_experiment_0/synthesis

### Sum up the GPP across PFTs
ncwa -O -h -v GPP -a pft -y total output/GPP_monthly_tr.nc synthesis/GPP_monthly_tr.nc
ncwa -O -h -v GPP -a pft -y total output/GPP_monthly_sc.nc synthesis/GPP_monthly_sc.nc

### Append all the necessary fluxes into single files
cp synthesis/GPP_monthly_tr.nc synthesis/Cfluxes_monthly_tr.nc
ncks -A -h output/RM_monthly_tr.nc synthesis/Cfluxes_monthly_tr.nc
ncks -A -h output/RG_monthly_tr.nc synthesis/Cfluxes_monthly_tr.nc
ncks -A -h output/RHSOM_monthly_tr.nc synthesis/Cfluxes_monthly_tr.nc
cp synthesis/GPP_monthly_sc.nc synthesis/Cfluxes_monthly_sc.nc
ncks -A -h output/RM_monthly_sc.nc synthesis/Cfluxes_monthly_sc.nc
ncks -A -h output/RG_monthly_sc.nc synthesis/Cfluxes_monthly_sc.nc
ncks -A -h output/RHSOM_monthly_sc.nc synthesis/Cfluxes_monthly_sc.nc

### Compute monthly NEE
ncap2 -O -h -s'NEE = RHSOM + RG + RM - GPP' synthesis/Cfluxes_monthly_tr.nc synthesis/Cfluxes_monthly_tr.nc
ncap2 -O -h -s'NEE = RHSOM + RG + RM - GPP' synthesis/Cfluxes_monthly_sc.nc synthesis/Cfluxes_monthly_sc.nc

### Compute yearly sums of fluxes (this is a sum by group, i.e. years,
### so we'll need to indicate the --mro option in ncra)
# make time dimension unlimited
ncks -O -h --mk_rec_dmn time synthesis/Cfluxes_monthly_tr.nc synthesis/Cfluxes_monthly_tr.nc
ncks -O -h --mk_rec_dmn time synthesis/Cfluxes_monthly_sc.nc synthesis/Cfluxes_monthly_sc.nc
# compute the annual sums
ncra --mro -O -d time,0,,12,12 -d x,0 -d y,0 -y ttl -v GPP,RG,RM,RHSOM,NEE synthesis/Cfluxes_monthly_tr.nc synthesis/Cfluxes_yearly_tr.nc
ncra --mro -O -d time,0,,12,12 -d x,0 -d y,0 -y ttl -v GPP,RG,RM,RHSOM,NEE synthesis/Cfluxes_monthly_sc.nc synthesis/Cfluxes_yearly_sc.nc
# fix back the time dimension
ncks -O -h --fix_rec_dmn time synthesis/Cfluxes_monthly_tr.nc synthesis/Cfluxes_yearly_tr.nc
ncks -O -h --fix_rec_dmn time synthesis/Cfluxes_monthly_sc.nc synthesis/Cfluxes_yearly_sc.nc

### Compute decadale averages of C fluxes
ncwa -O -d time,89,98 -d x,0 -d y,0 -y avg -v GPP,RG,RM,RHSOM,NEE synthesis/Cfluxes_yearly_tr.nc synthesis/Cfluxes_1990_1999.nc
ncwa -O -d time,24,33 -d x,0 -d y,0 -y avg -v GPP,RG,RM,RHSOM,NEE synthesis/Cfluxes_yearly_sc.nc synthesis/Cfluxes_2040_2049.nc
ncwa -O -d time,74,83 -d x,0 -d y,0 -y avg -v GPP,RG,RM,RHSOM,NEE synthesis/Cfluxes_yearly_sc.nc synthesis/Cfluxes_2090_2099.nc
3.6. Computing Mean GPP, RA, RHSOM, NEE
Compute the mean GPP, autotrophic and heterotrophic respirations and NEE for the following time ranges: [1990-1999], [2040-2049], [2090-2099].
What are the units of these fluxes?
Example Python Solution for Finding Units
print('{:>10} {:>12} {:>12}'.format('varible', 'tr', 'sc'))
for v in ['GPP', 'RHSOM', 'RM','RG',]:
    trds = nc.Dataset(f'output/{v}_monthly_tr.nc')
    scds = nc.Dataset(f'output/{v}_monthly_sc.nc')
    tunits = trds.variables[v].units
    sunits = scds.variables[v].units
    print(f'{v:>10} {tunits:>12} {sunits:>12}')
varible tr sc GPP g/m2/month g/m2/month RHSOM g/m2/month g/m2/month RM g/m2/month g/m2/month RG g/m2/month g/m2/month
Example Python Solution for Computing Means
# Using the variables loaded above when we computed NEE

for d in ['1990-1999','2040-2049','2090-2099']:
  start, end = d.split('-')
  mean_gpp = gpp[start:end].sum(axis=1).mean()
  ra = rm + rg
  mean_ra = ra[start:end].mean().squeeze() # <- collapses DataFrame to Series
  mean_rh = rh[start:end].mean().squeeze() # <- collapses DataFrame to Series
  mean_nee = nee[start:end].mean()

  print(f"{d} mean gpp: {mean_gpp}")
  print(f"{d} mean ra:  {mean_ra}")
  print(f"{d} mean rh:  {mean_rh}")
  print(f"{d} mean nee: {mean_nee}")
  print()
1990-1999 mean gpp: 18.930091254551858
1990-1999 mean ra:  10.701863890274359
1990-1999 mean rh:  7.128647648073941
1990-1999 mean nee: 1.0995797162035559

2040-2049 mean gpp: 27.93656288951244
2040-2049 mean ra:  16.929092213796437
2040-2049 mean rh:  10.624491440526375
2040-2049 mean nee: 0.38297923518962734

2090-2099 mean gpp: 46.30364374616796
2090-2099 mean ra:  30.153753220069856
2090-2099 mean rh:  15.57865774475049
2090-2099 mean nee: 0.5712327813476122
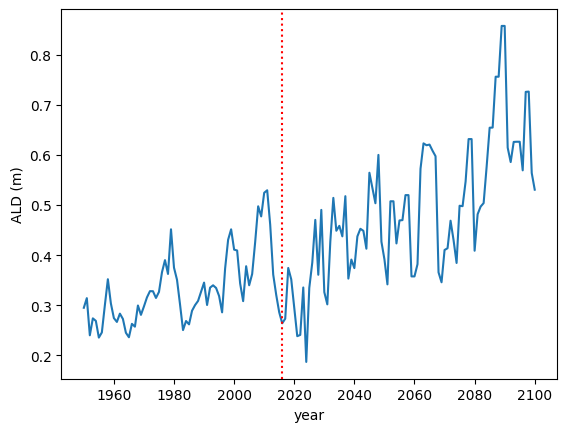
3.7. Plot Active Layer Depth
Plot the active layer depth from 1950 to 2100.
Example Python Solution
df, meta = load_trsc_dataframe(var='ALD', timeres='yearly',
                               px_y=0, px_x=0, fileprefix='output')

fig, ax = plt.subplots(1,1)

ax.plot(df.loc['1950':'2100'].index, df.loc['1950':'2100'][0], label='ALD')
ax.axvline(df.index[115], linestyle='dotted', color='red')

ax.set_xlabel('year')
ax.set_ylabel('ALD ({})'.format(meta['var_units']))

plt.savefig('ALD_SAMPLE.png')
Trying to open:  output/ALD_yearly_tr.nc
Trying to open:  output/ALD_yearly_sc.nc
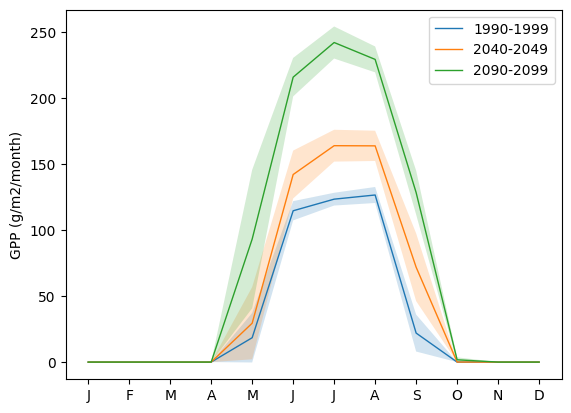
3.8. Plot Seasonal Dynamic
Plot the seasonal dynamic of GPP for the same three time ranges: [1990-1999], [2040-2049], [2090-2099]. The plot should show the mean monthly GPP computed across each decade as lines, and the standard deviation across the mean as envelopes.
Example Python Solution
df, meta = load_trsc_dataframe(var='GPP', timeres='monthly',
                               px_y=0, px_x=0, fileprefix='output')

# sum across PFTs...
ecosystem_sum = df.sum(axis=1)

fig, ax = plt.subplots(1,1)

for time_period in ['1990-1999','2040-2049', '2090-2099']:
  startyr, endyr = time_period.split('-')

  # The result is a pandas.Series
  range_series = ecosystem_sum[startyr:endyr]

  mean = range_series.groupby(range_series.index.month).mean()
  std =  range_series.groupby(range_series.index.month).std()

  ax.plot(mean, linewidth=1, label=time_period)
  ax.fill_between(mean.index, mean - std, mean + std, alpha=0.2)
  ax.set_ylabel('GPP ({})'.format(meta['var_units']))
  ax.legend()

ax.set_xticks(range(1,13), 'J,F,M,A,M,J,J,A,S,O,N,D'.split(','))

plt.show()
Trying to open:  output/GPP_monthly_tr.nc
Trying to open:  output/GPP_monthly_sc.nc
3.9. Plot Soil Temperatures
Plot the soil temperature profile for [June-July-August] period for the same three ranges: [1990-2999], [2040-2049], [2090-2099]. The plot should show the mean summer temperature computed across each decade as lines, and the standard deviation across the mean as envelops.
Example Python Solution
Write this…